Enhance Operational Efficiency Through Intelligent Dashboard Insights
Hexastate offers you a unified view of your production, saving you time and reducing errors in decision-making.
What we offer:
✔ Flexible dashboards displaying a range of sensor data and KPIs.
✔ Real-time alerts and analytics for immediate corrective actions.
✔ Integration with other production metrics for a comprehensive overview.
✔ Customizable KPIs for deeper insights into your operations.
✔ Remote access for data-driven decisions from anywhere.
✔ Scalable solution that can grow with your business needs.
Contact us to learn how Hexastate’s dashboards can provide actionable insights for your business.
Our customers experience up to:
%
Increase in operational efficiency
%
Reduction in decision-making time
%
Reduction of imperfect data
Explore what the platform has to offer
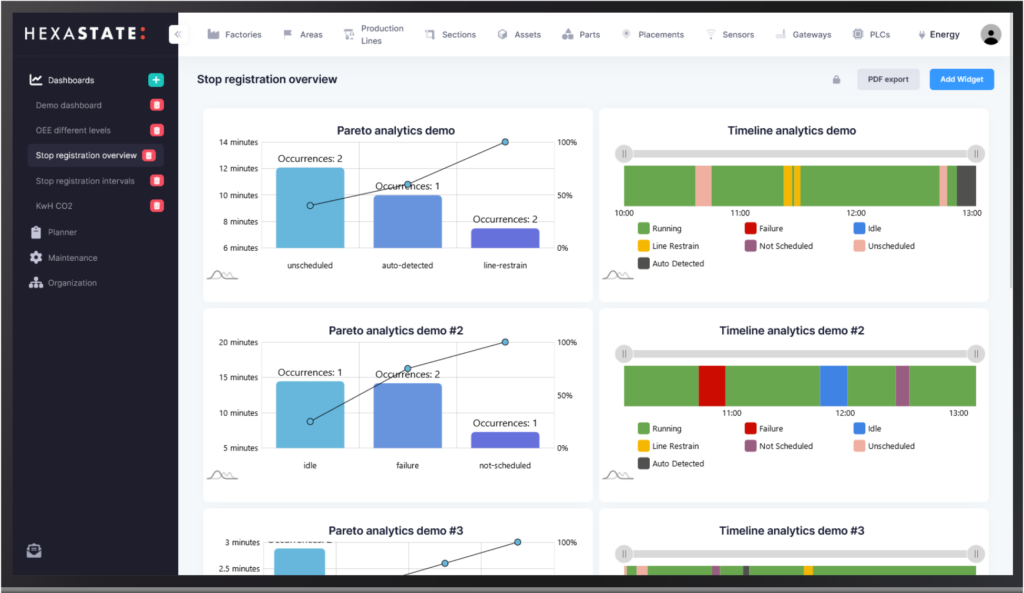
Identify bottlenecks in your production with the pareto widget
Get a real-time overview of the operational events on your production line with the timeline widget
Dynamic Dashboard with Downtime Insights
Our dynamic dashboards goes beyond just data visualization.
The Pareto widget highlights your production’s most significant bottlenecks, so you can focus your resources where they are most needed.
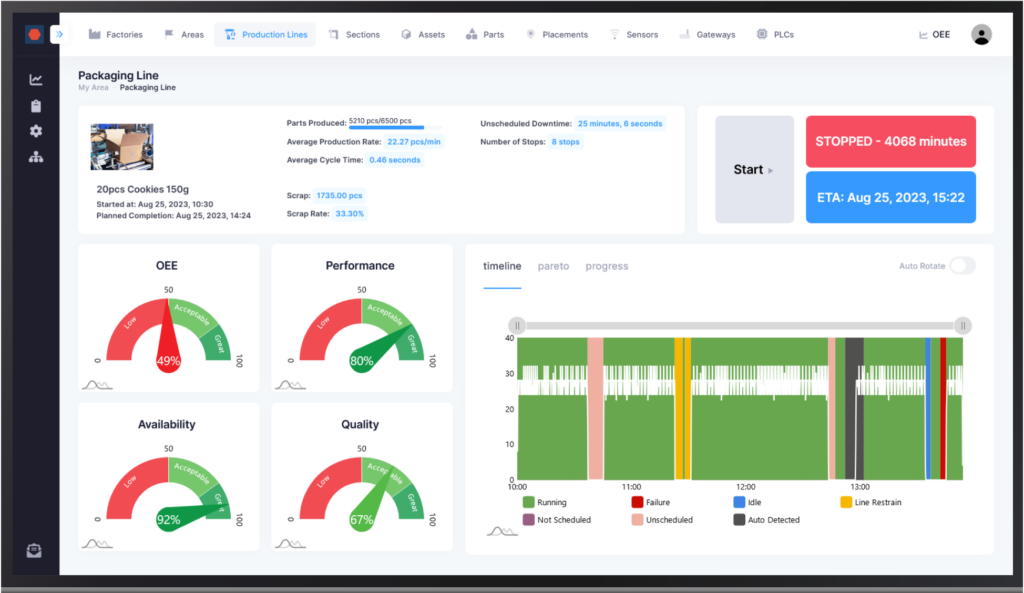
The nameplate section shows all the relevant OEE variables for the current batch, to get you the insights you need, without hassle
The OEE Metrics section calculates OEE and its related values in real-time and displays it in understandable gauge charts
Get a complete overview of the operational events that have happened during the current batch
OEE Details Page with Timeline
Our OEE details page comes with a timeline feature that gives you a chronological overview of operational events affecting happening in real-time on your production line.
This visual tool helps you to identify stops and take proactive measures to improve efficiency.
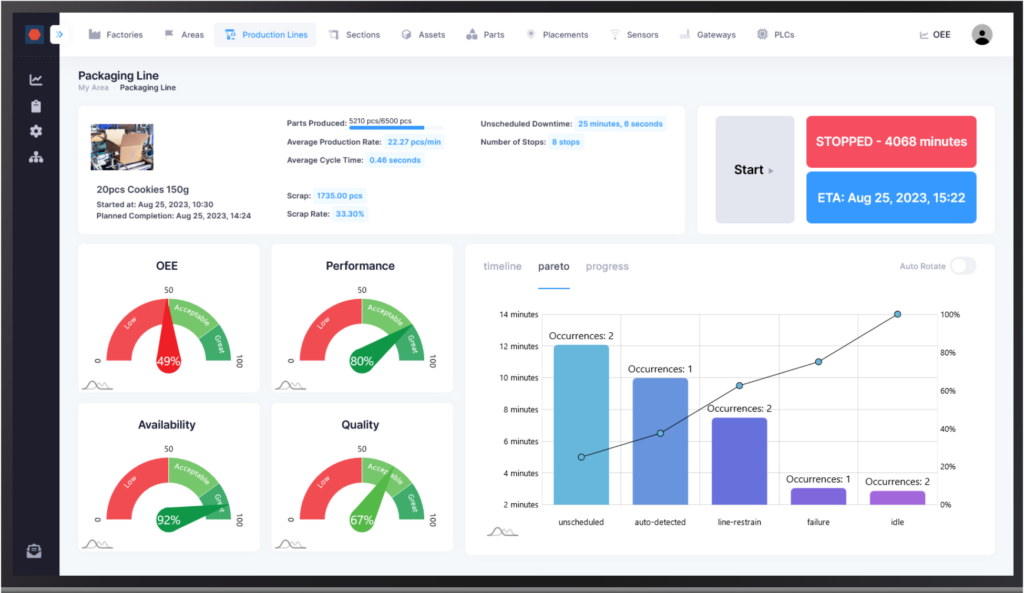
The nameplate section shows all the relevant OEE variables for the current batch, to get you the insights you need, without hassle.
The OEE Metrics section calculates OEE in real-time and displays it in an understandable gauge chart
The pareto chart shows the most time consuming stop causes in real-time on the production line
OEE Details Page with Pareto Chart
Explore your OEE in real-time on our specialized details page.
The pareto chart outlines the most time consuming stop-causes on a production line, allowing you to prioritize issues and implement effective solutions.
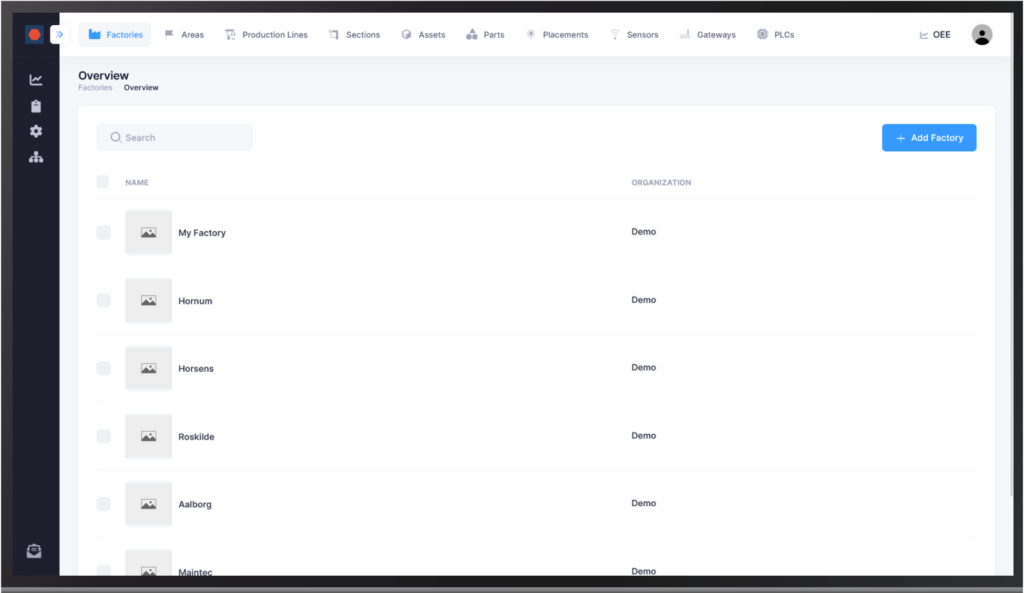
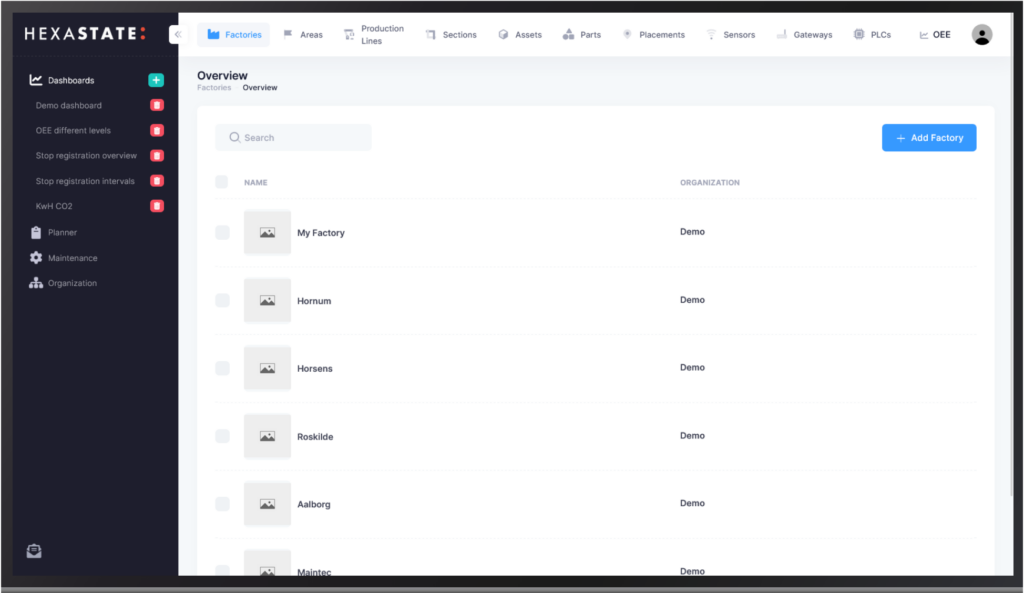
Manage all your entities through our simple navigation header
Search, filter or browse through available entities through the table view
Entity Overview in Table Format
The Entity Overview screen provides you with a comprehensive table-view format that includes all essential details.
Easily sift through factories, areas, production lines, assets, and sensors to manage your operations better.
Gain access to our stand-alone features, setup your organization and contact support through the sidebar.
Sidebar Navigation
The sidebar is your central navigation hub, offering quick access to a range of our features.
This includes our dynamic dashboards for KPI monitoring, the production planner for scheduling, the maintenance planner for upkeep, and organization setup for configuring your workspace.
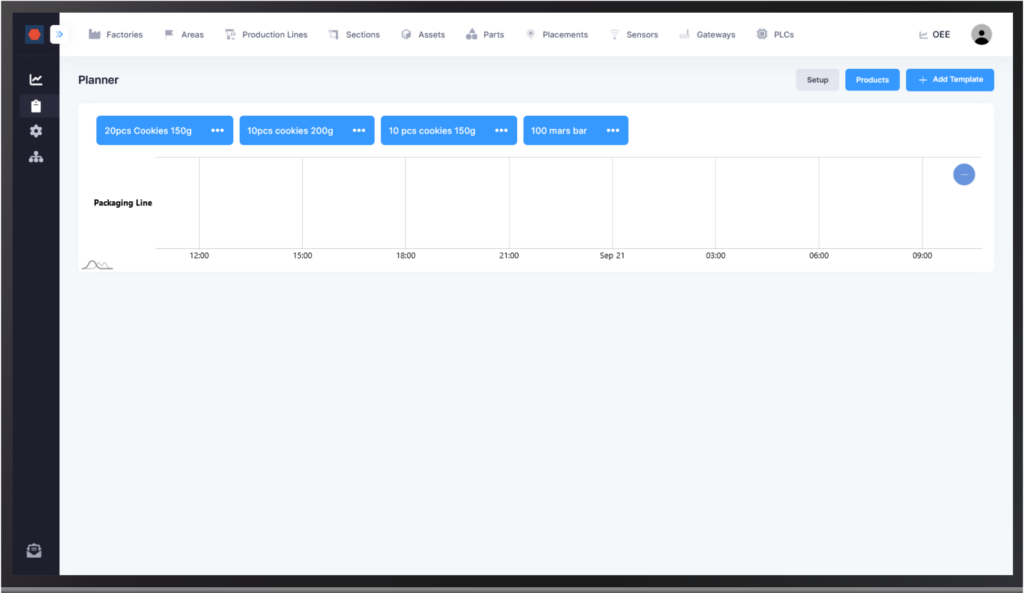
Get a simplistic overview of your production lines, and the batches planned on them.
Batch templates that can be easily scheduled. Includes SKU, order number, expected production rate and total order quantity.
Production Planner - Gantt Chart
Our Production Planner integrates a Gantt chart view to help you oversee multiple production lines simultaneously.
Here, you can establish and monitor production batches, ensuring seamless coordination of activities for optimized productivity.
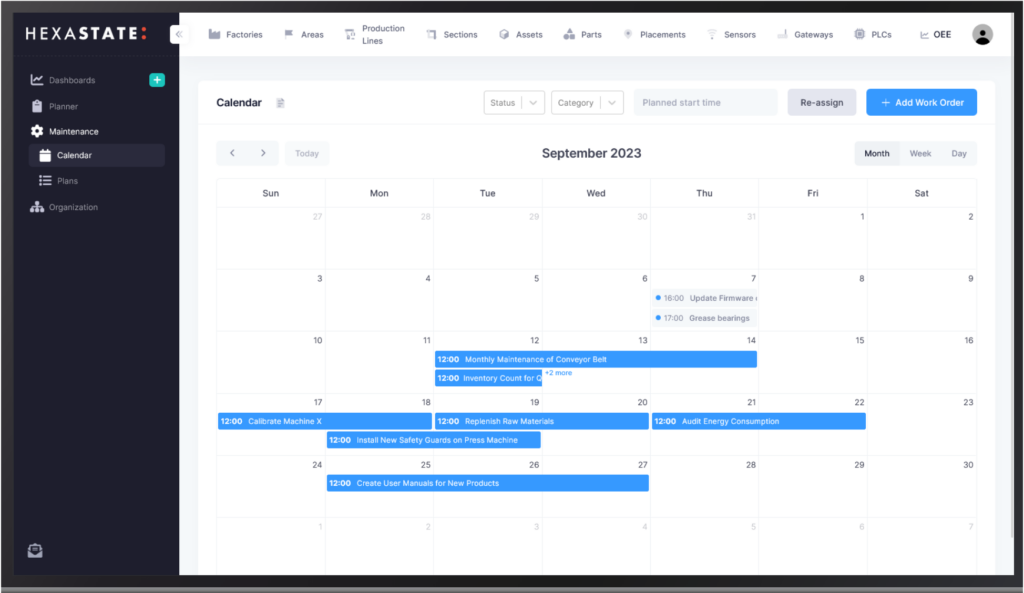
The month view shows an overview of the work orders that are planned in your organization this month.
Maintenance Planner - Month View
Our Maintenance Planner allows for forward-thinking maintenance scheduling.
Create work orders for all types of entities and assign these to your team. Create checklists, and upload files to keep everyone in sync and eliminate paperwork.
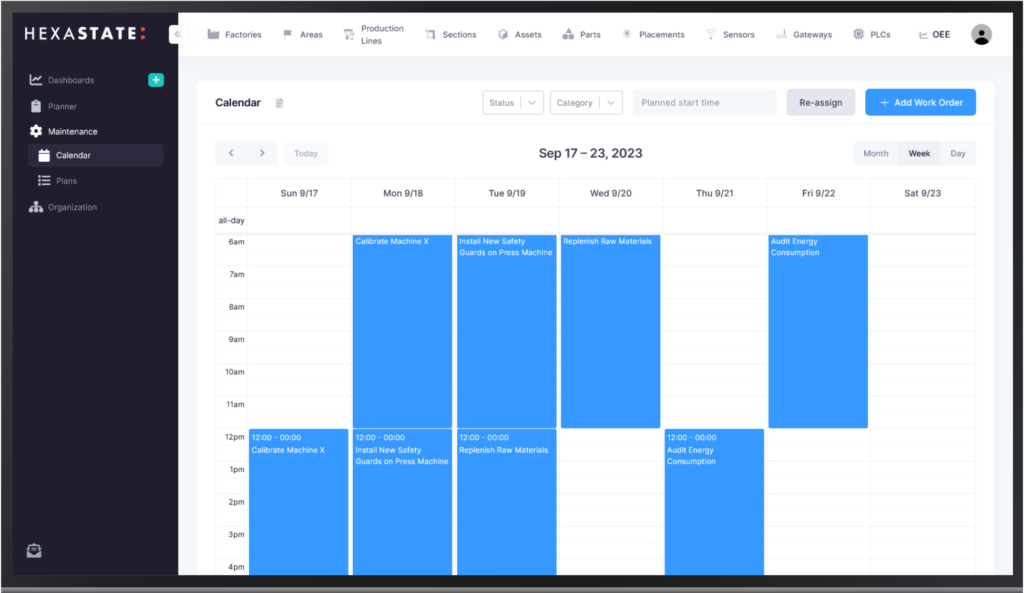
The weekly view shows an overview of the work orders that are planned in your organization this week, for easy management.
Maintenance Planner - Weekly View
For a more immediate overview, the Maintenance Planner also offers a weekly view.
This layout lets you quickly create work orders, assign them to the appropriate personnel, create checklists, and upload any necessary documentation.
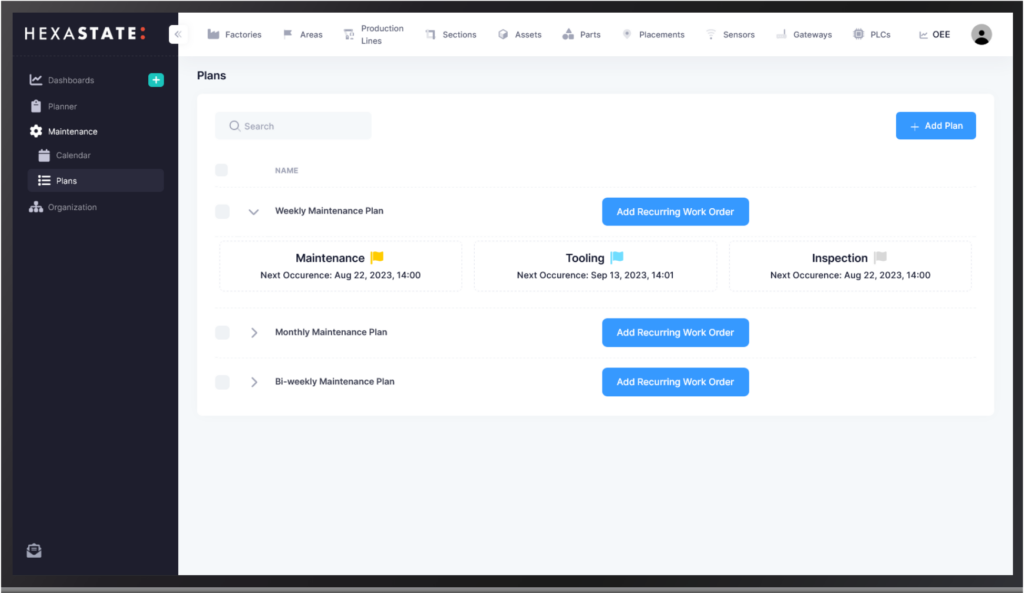
Create and manage fully featured preventive maintenance plans, with work orders at a specific time. Get rid of the paper-based manuals and plan maintenance smarter today.
Preventive Maintenance Planning
With our Preventive Maintenance Planner tool, you can create fully customized recurring work orders.
These can be set based on a machines operational hours, specific days of the week, or even particular dates each month, offering flexibility and proactive management.
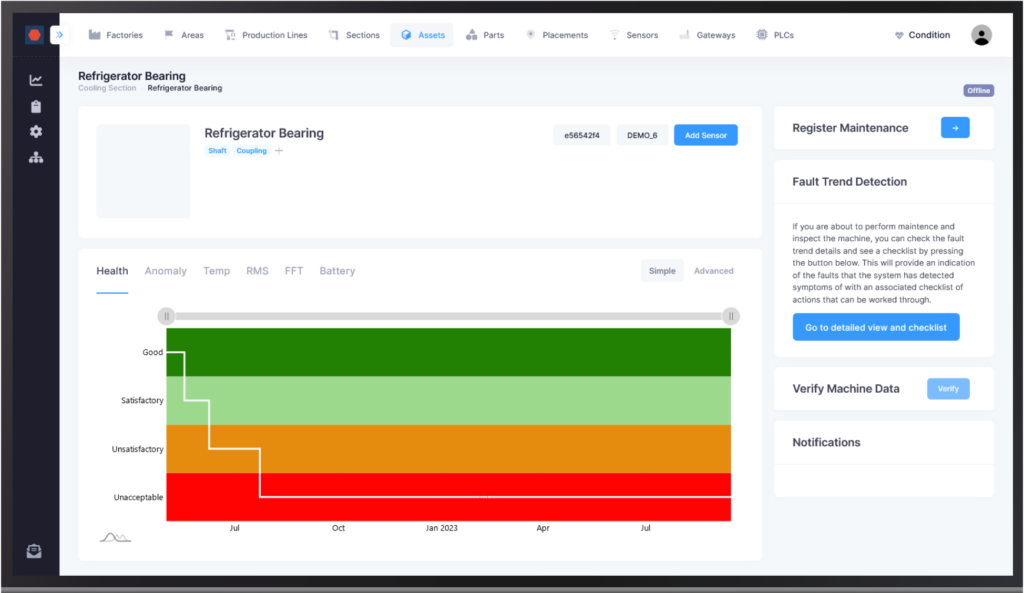
Easily add pictures of your machine to its gallery. It is recommended to store the information from the nameplate in here.
The health graphs is divided into 4 colors, indicating the overall condition of the machine. When the state changes, a notification will be sent out, allowing for maintenance to be planned ahead.
The fault trend detection and checklist outlines specific symptoms of faults in the machine, if any are found.
Asset Detail Page - Vibration Analysis
Monitor asset health effortlessly on the asset detail page. The health graph gives a simplistic overview of the asset's condition.
Utilize vibration analysis for in-depth fault trends and symptoms, all presented alongside a practical checklist for mitigation.
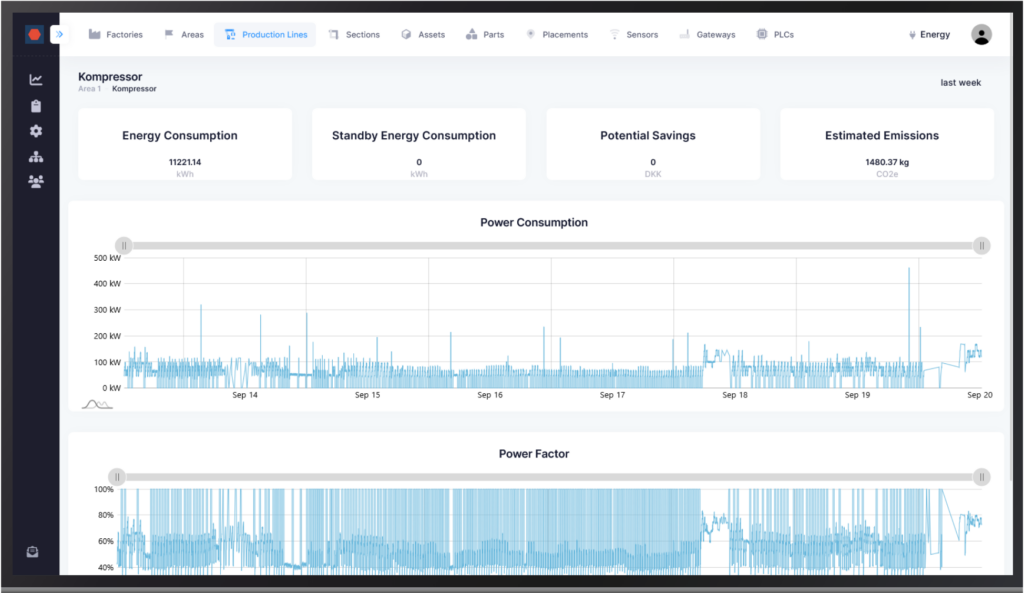
Emissions can be estimated based on API data from government entities, calculated based on a constant, or modified to only include green power in the emissions.
Track the energy consumption of an entity in real-time
Energy Monitoring Details Page
The Energy Monitoring page is designed to give you an in-depth understanding of your energy consumption patterns.
This includes real-time tracking of energy usage, standby usage, potential savings, and even estimates of your emissions to guide eco-friendly operations.
