Elevate Your Energy Efficiency with Hexastate
Streamline your energy management efforts with real-time insights and actionable data.
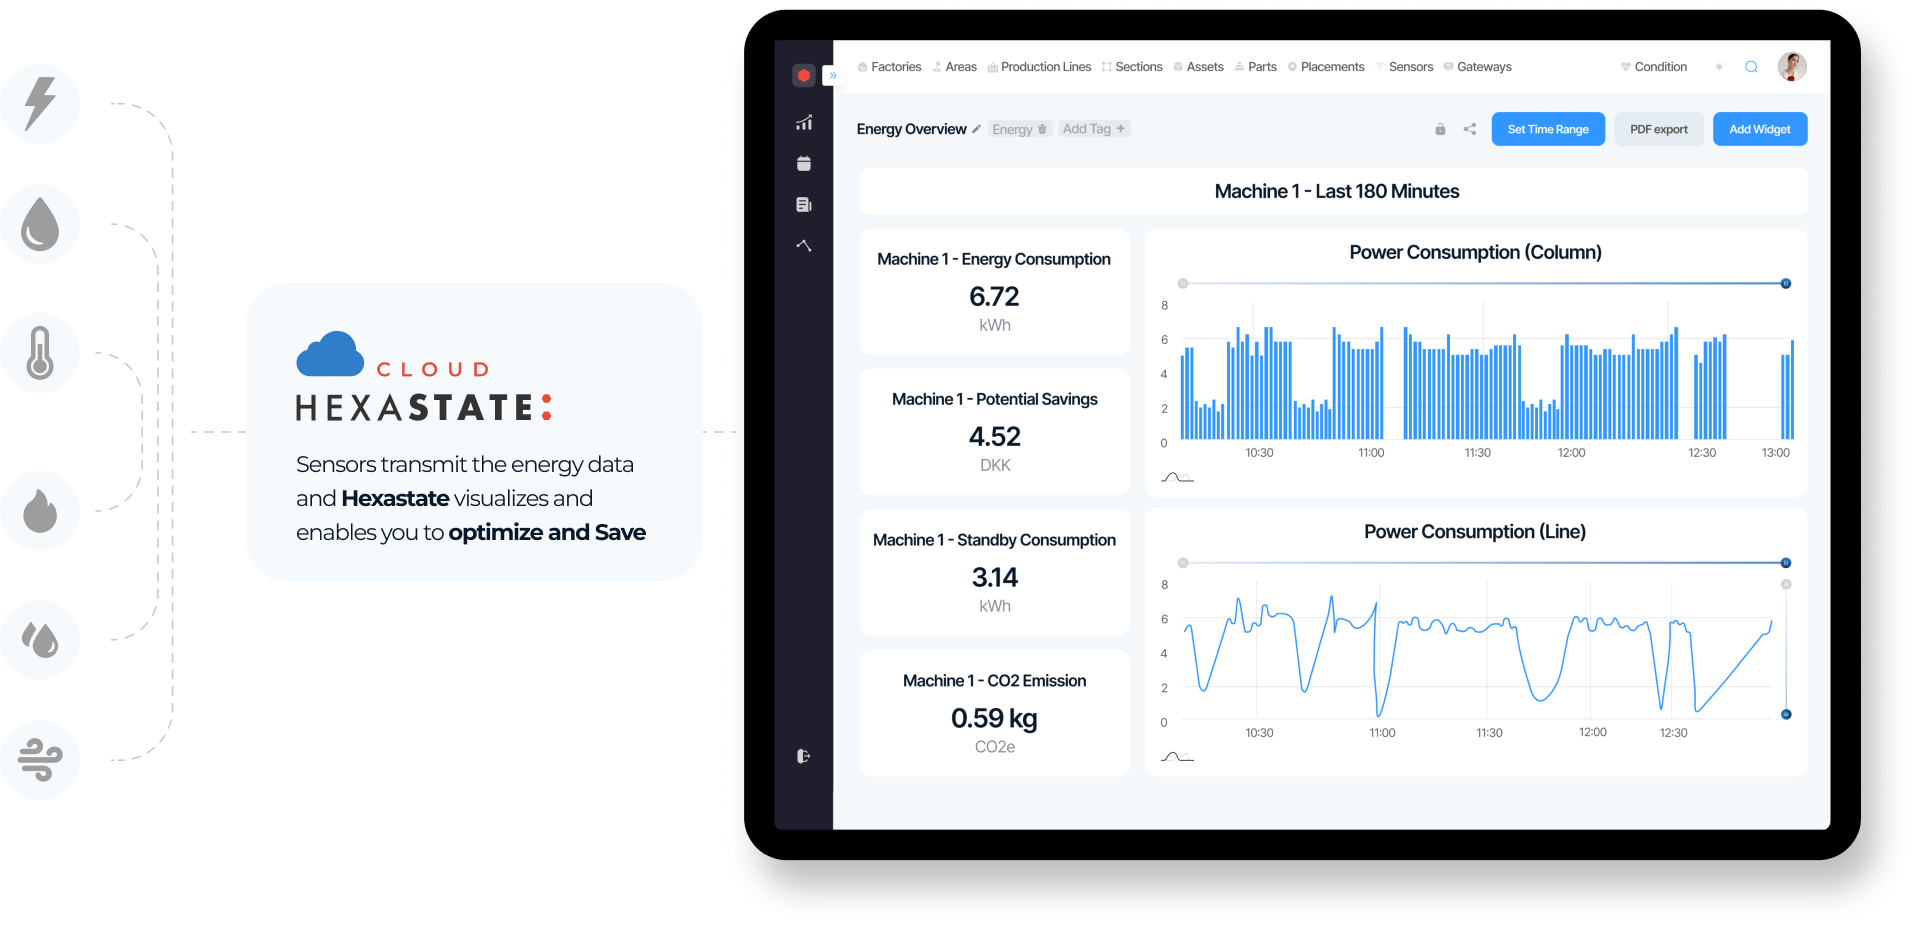
Solution Overview
Energy Overview
Energy Overview
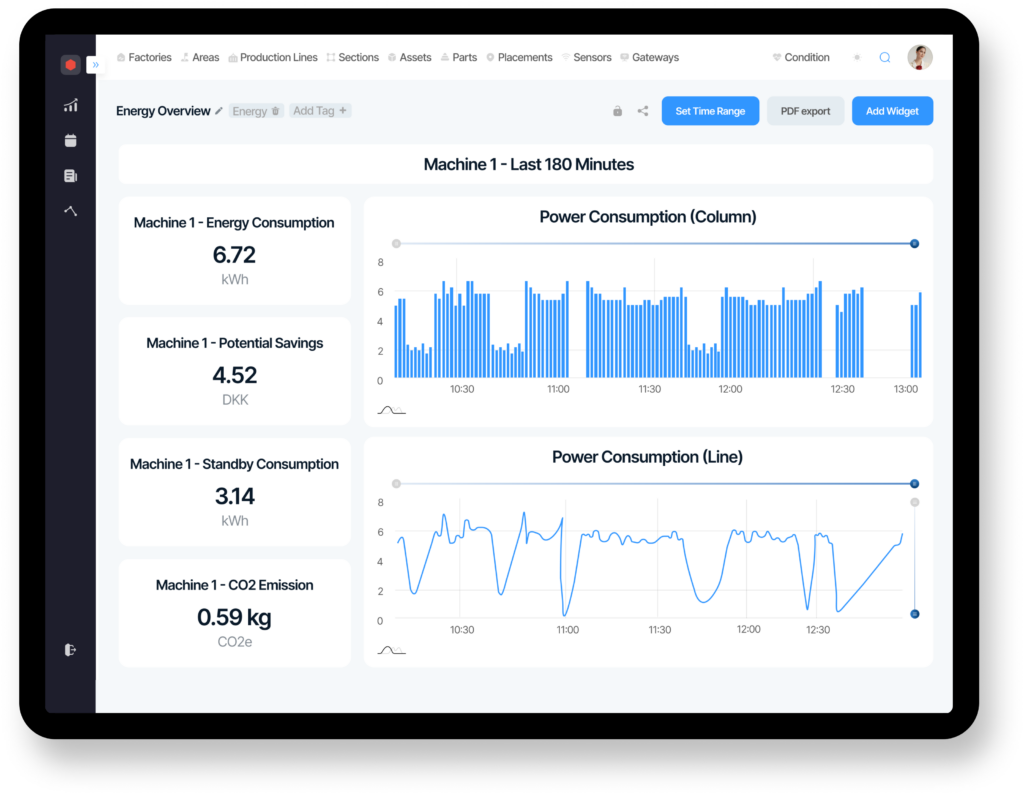
- Energy Overview: See the energy details of your factory or production floor. Power, water, heat, and gas can all be combined in a single dashboard.
- Simple Column Charts: Get a quick read on energy usage with clear, simple charts.
- Visualize energy usage for a whole month or day-to-day basis.
- Spot Trends Easily: When doing manual analysis, line charts helps to notice energy patterns and anomalies.
Analytics
Analytics
- Insightful Data: Use Hexastate's Analytics for deep dives into your energy data, turning numbers into actionable insights.
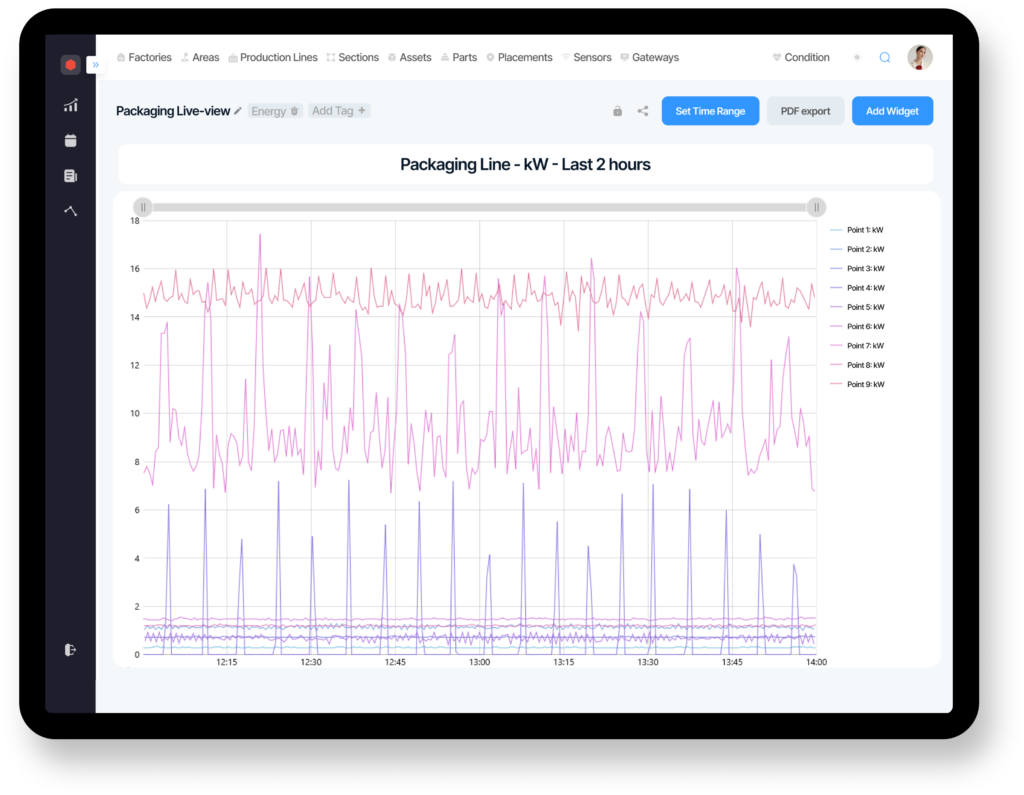
- Custom Visualizations: Set up charts to view and compare energy across many levels - from individual sensors to the entire facility.
- Time-Based Analysis: Use timeline comparisons to compare utilization trends and identify opportunities for optimizing.
- Comparative analysis: Utilize the Multiline Comparison widget for an overview of energy patterns across multiple sensors.
ESG
ESG reporting made simple
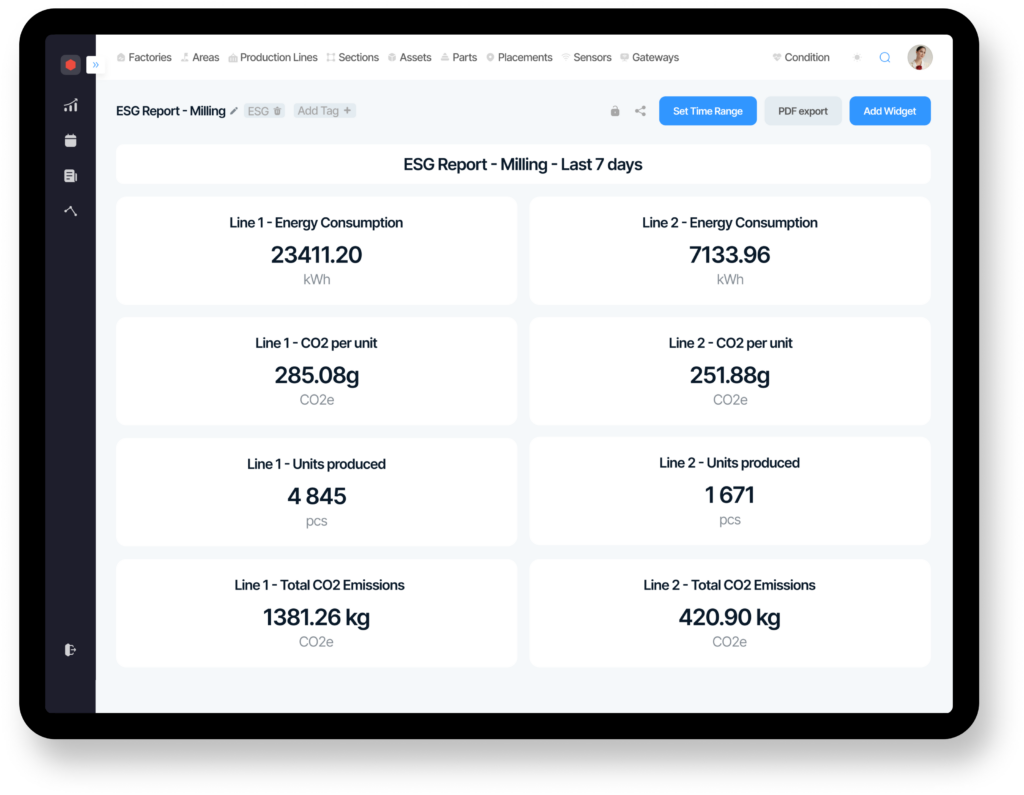
- Build Better Reports: Let Hexastate be your ally in creating comprehensive Environmental, Social, and Governance reports to be automatically calculated and exported.
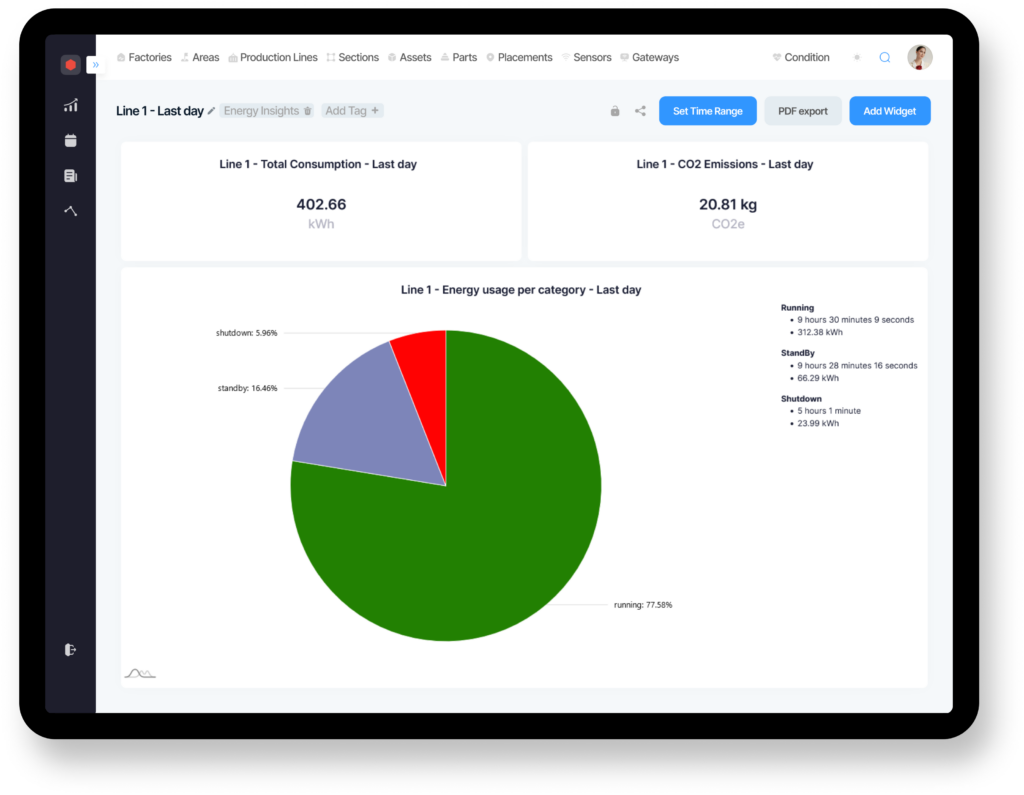
- Track CO2 Emissions: CO2 emission data is automatically fetched and calculated, for all your internal reporting needs.
- Product-Specific Emissions: Get detailed CO2 numbers for each batch or each product, enhancing transparency for your customers.
Alarms
Alarms
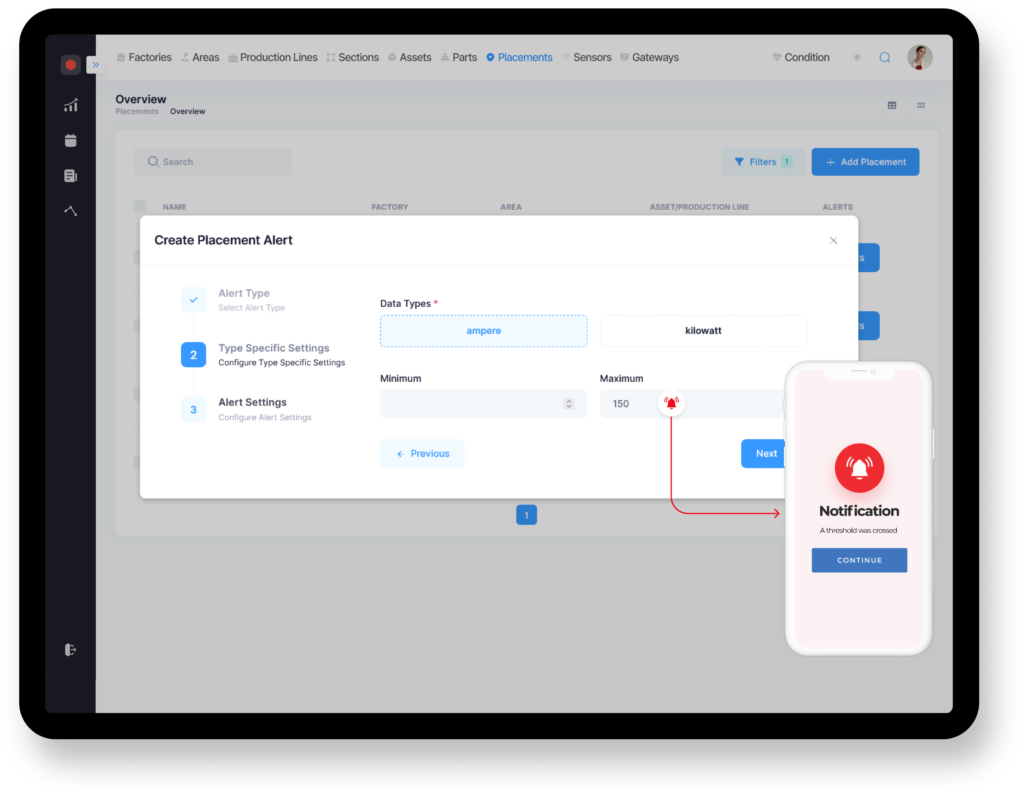
- Direct Notifications: Receive SMS or email alerts directly, ensuring you're promptly informed of significant changes in energy usage.
- Fully Customizable: Set custom parameters for energy alarms, including cooldowns, custom messages, and different triggers, for example:
- Get notified when energy consumption exceeds predefined limits.
- Get alarmed when energy usage deviates from scheduled downtimes.
Hardware
Hassle-Free Hardware Setup
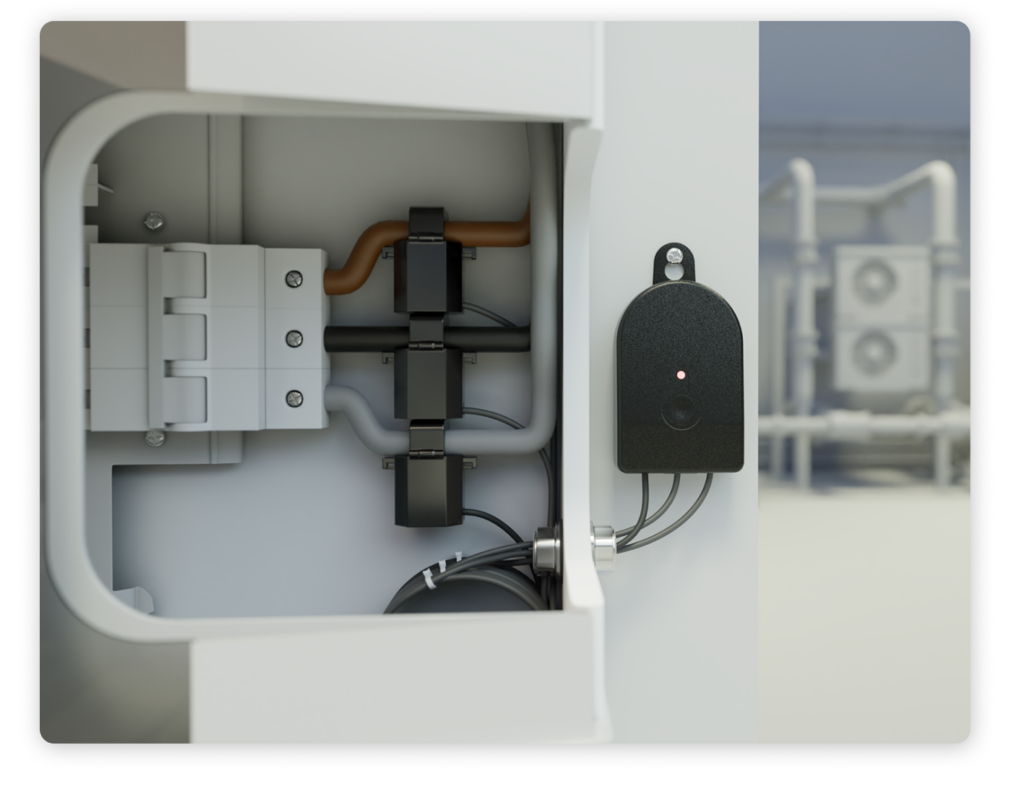
- Effortless Installation: Our standard hardware for energy monitoring is a plug-and-play solution for a quick and easy start.
- Non-invasive Design: The CT Clamps are an easy-to-install solution that won’t disrupt your production cycle or workspace.
- Durable and Reliable: The hardware is designed for exposure to industrial environments, so you won't have to worry about outages.
- Simple Configuration: A quick scan of a QR code is all it takes to set up a sensor on a placement.
Understanding Uptime
Energy Data for OEE Enhancement
- Maximize Uptime: Quickly see how much your machines are running and how much they’re not, based on defined operational states.
- Spot Savings: Compare energy usage to operational time to identify inefficiencies.
- Full Picture Efficiency: Combine energy data with OEE features for a complete view of how your production is performing.For example:
- Visualize operator-logged events alongside the energy data to truly understand the uptime of a machine in a simple timeline format.
Your new toolbox
- Energy Optimization (EO)
- Front Page (FP)
- Production Optimization (PO)
- Globals (GBS)
- Machine Health (MH)
- Maintenance Planner (MP)
- Machine Health
- Energy Overview
- Work Order
- Condition Monitoring
- Analytics
- Fault Trends
- Preventive
- OEE
- ESG
- Alarms
- Easy Overview
- Energy Monitoring
- Hardware
- Maintenance
- Financial Understanding
- Log of history
- Dashboards
- Alarms
- Verify Machine Data
- Inventory
- Integrations
- Hardware
- Retrofit
- Maintenance Stats
- Dashboard Builder
- Overview of Plant
- Integration
- Understanding Uptime
- Dashboards
- Automations
- User Management
- Reports
- App Center
- API and Integrations
- Template Center
- OEE Dashboards
- Event Registration
- Management
- Operators
- Production Planner
- Analysis for OEE
- Alarms
- Data Collection
- MP: Dashboard Builder
Energy Overview
Energy Overview
- Energy Overview: See the energy details of your factory or production floor. Power, water, heat, and gas can all be combined in a single dashboard.
- Simple Column Charts: Get a quick read on energy usage with clear, simple charts.
- Visualize energy usage for a whole month or day-to-day basis.
- Spot Trends Easily: When doing manual analysis, line charts helps to notice energy patterns and anomalies.

Analytics
Analytics
- Insightful Data: Use Hexastate's Analytics for deep dives into your energy data, turning numbers into actionable insights.
- Custom Visualizations: Set up charts to view and compare energy across many levels - from individual sensors to the entire facility.
- Time-Based Analysis: Use timeline comparisons to compare utilization trends and identify opportunities for optimizing.
- Comparative analysis: Utilize the Multiline Comparison widget for an overview of energy patterns across multiple sensors.

ESG
ESG reporting made simple
- Build Better Reports: Let Hexastate be your ally in creating comprehensive Environmental, Social, and Governance reports to be automatically calculated and exported.
- Track CO2 Emissions: CO2 emission data is automatically fetched and calculated, for all your internal reporting needs.
- Product-Specific Emissions: Get detailed CO2 numbers for each batch or each product, enhancing transparency for your customers.

Alarms
Alarms
- Direct Notifications: Receive SMS or email alerts directly, ensuring you're promptly informed of significant changes in energy usage.
- Fully Customizable: Set custom parameters for energy alarms, including cooldowns, custom messages, and different triggers, for example:
- Get notified when energy consumption exceeds predefined limits.
- Get alarmed when energy usage deviates from scheduled downtimes.

Hardware
Hassle-Free Hardware Setup
- Effortless Installation: Our standard hardware for energy monitoring is a plug-and-play solution for a quick and easy start.
- Non-invasive Design: The CT Clamps are an easy-to-install solution that won’t disrupt your production cycle or workspace.
- Durable and Reliable: The hardware is designed for exposure to industrial environments, so you won't have to worry about outages.
- Simple Configuration: A quick scan of a QR code is all it takes to set up a sensor on a placement.

Understanding Uptime
Energy Data for OEE Enhancement
- Maximize Uptime: Quickly see how much your machines are running and how much they’re not, based on defined operational states.
- Spot Savings: Compare energy usage to operational time to identify inefficiencies.
- Full Picture Efficiency: Combine energy data with OEE features for a complete view of how your production is performing.For example:
- Visualize operator-logged events alongside the energy data to truly understand the uptime of a machine in a simple timeline format.

Energy Monitoring Webinar
Watch a short, 20-minute webinar about the energy monitoring solution to learn more!
The webinar goes through the following subjects:
- An introduction to Hexastate and our core mission.
- Introduction to energy monitoring and the current technological environment.
- How energy data can be viewed and represented.
- How to utilize the solution for identifying wasteful processes or unplanned energy consumption
ROI Calculation
Visualize the economics of an energy monitoring solution
Energy Decrease 8.0%
Yearly decrease in energy usage12000 units
Yearly cost savings240000


